Pythonでは、Streamlitというwebアプリを簡単に作成可能なライブラリー(フレームワーク)が提供されている。
- サンプルプログラム:streamlitでできること
- 導入と実行方法
- 各要素・イベント管理
1. サンプルプログラム:streamlitでできること
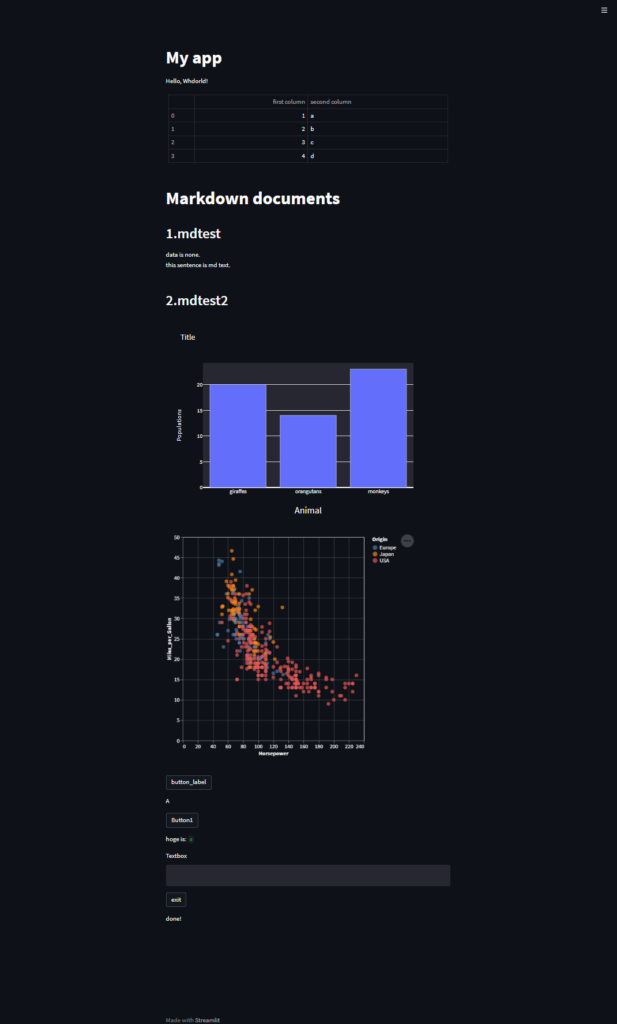
実行結果:テーブル、マークダウン(HTMLテキスト)、グラフ、ボタン(クリックイベント)、テキスト入力(テキストインプット)などが実装できる。下記はchrome上で表示させた例。

上記、実行結果例のコードは下記の通り。
# コード
# -*- coding: utf-8 -*-
#
# リファレンス▼
# https://docs.streamlit.io/library/api-reference
# 参考サイト▼
# https://zenn.dev/canard0328/articles/streamlit_how_to_use
import subprocess
from itertools import count
import sys
import streamlit as st
import pandas as pd
import plotly.graph_objs as go      # pip install plotly
import altair as alt                # pip install altair
from vega_datasets import data      # pip install vega_datasets

data_sample_pd01 = pd.DataFrame(
    {
        'first column': [1, 2, 3, 4],
        'second column': ["a", "b", "c", "d"]
    }
)
data_markdown_01 = "# Markdown documents"
animals = ['giraffes', 'orangutans', 'monkeys']
populations = [20, 14, 23]

fig = go.Figure(data=[go.Bar(x=animals, y=populations)])

source = data.cars()

fig_vgdata = alt.Chart(source).mark_circle(size=60).encode(
    x='Horsepower',
    y='Miles_per_Gallon',
    color='Origin',
    tooltip=['Name', 'Origin', 'Horsepower', 'Miles_per_Gallon']
).properties(
    width=500,
    height=500
).interactive()

fig.update_layout(
    xaxis = dict(
        tickangle = 0,
        title_text = "Animal",
        title_font = {"size": 20},
        title_standoff = 25),
    yaxis = dict(
        title_text = "Populations",
        title_standoff = 25),
    title ='Title')

count_answer = 0
# def st_button_click():
#     global count_answer
#     count_answer = count_answer + 1
#     st.write(f"count:{count_answer}")
#     return (bool)(True)

def update_txtbox():
    st.write(st.session_state.txtbox1)


# function: Streamlitに対応している任意のオブジェクトをブラウザ上に表示
# caution:  Streamlitではイベント発生時にスクリプト全体が再実行される
def main():
    global count_answer

    st.title('My app')              # タイトル
    st.write('Hello, Whdorld!')     # テキスト: pタグに相当
    st.table(data_sample_pd01)      # pandsのDataFrameの表示(table)
    st.markdown(data_markdown_01)   # マークダウン記法によるテキストの表示
    st.markdown("## 1.mdtest")
    st.markdown("data is none.  \nthis sentence is md text.")
    st.markdown("")
    st.markdown("## 2.mdtest2")
    st.plotly_chart(fig, use_container_width=True)  # plotlyを使用したグラフの表示
    st.write(fig_vgdata)

    count_answer = 0
    # answer = st.button('button_label')
    answer = st.button('button_label', key=1, help=None, on_click=None, args=[1,2,3], kwargs=None, disabled=False)
    if answer == True:

        count_answer += 1
        # st.write(r"ボタンが押されました")
        if count_answer%2 == 1:
            st.write(f"ボタンが押されました{count_answer}")
            answer = st.button('button_label', key=2, help=None, on_click=None, args=[1,2,3], kwargs=None, disabled=False)
        elif count_answer%2 == 0:
            st.write(r"ボタンが押されました_re")
        answer = False
    else:
        st.write(r'A')


    if "hoge" not in st.session_state:
        st.session_state.hoge = 0
        # st.settion_state["hoge"] = 0 でもOK

    if st.button("Button1", key=3):
        st.session_state.hoge += 1

    st.write("hoge is:", st.session_state.hoge)

    data_text_input_01 = st.text_input("Textbox", key="txtbox1", on_change=update_txtbox)
    print(data_text_input_01)

    flag_exit = st.button('exit', key=4, help=None, on_click=None, args=None, kwargs=None, disabled=False)

    if flag_exit == True:
        app_02 = r"C:\WINDOWS\system32\cmd.exe" #
        args_02 = "Ctrl+C\n"
        subprocess.run(app_02)                    # 引数を取る必要のないアプリの起動
        # sys.exit()
    else:
        pass


if __name__ == '__main__':

    main()
    st.markdown("done!")
2. 導入と実行方法
まずはライブラリーのインストール。pip installで下記のようにインストール
# コード
pip install streamlit

# 会社や大学の場合は事前に下記のようなコマンドを実施する必要な場合がある。
set HTTP_PROXY=http://nnn.nnn.xxx.xxx
set HTTPS_PROXY=http://nnn.nnn.xxx.xxx
set USER=******
pip install –upgrade pip
これまではVScodeの実行ボタン(▶マーク)を押すか、python (ファイル名.py)で実行していたが、streamlitでは streamlit run (ファイル名.py)をターミナルで実行する必要がある。
# コード
# 普通のpythonファイル
python (ファイル名.py)

# streamlitを使用したpyファイル
streamlit run (ファイル名.py)
3. 各要素・イベント管理
nowloading…調査中…
EOF
